The Monitoring window shows the controller’s current control status in tabular form.
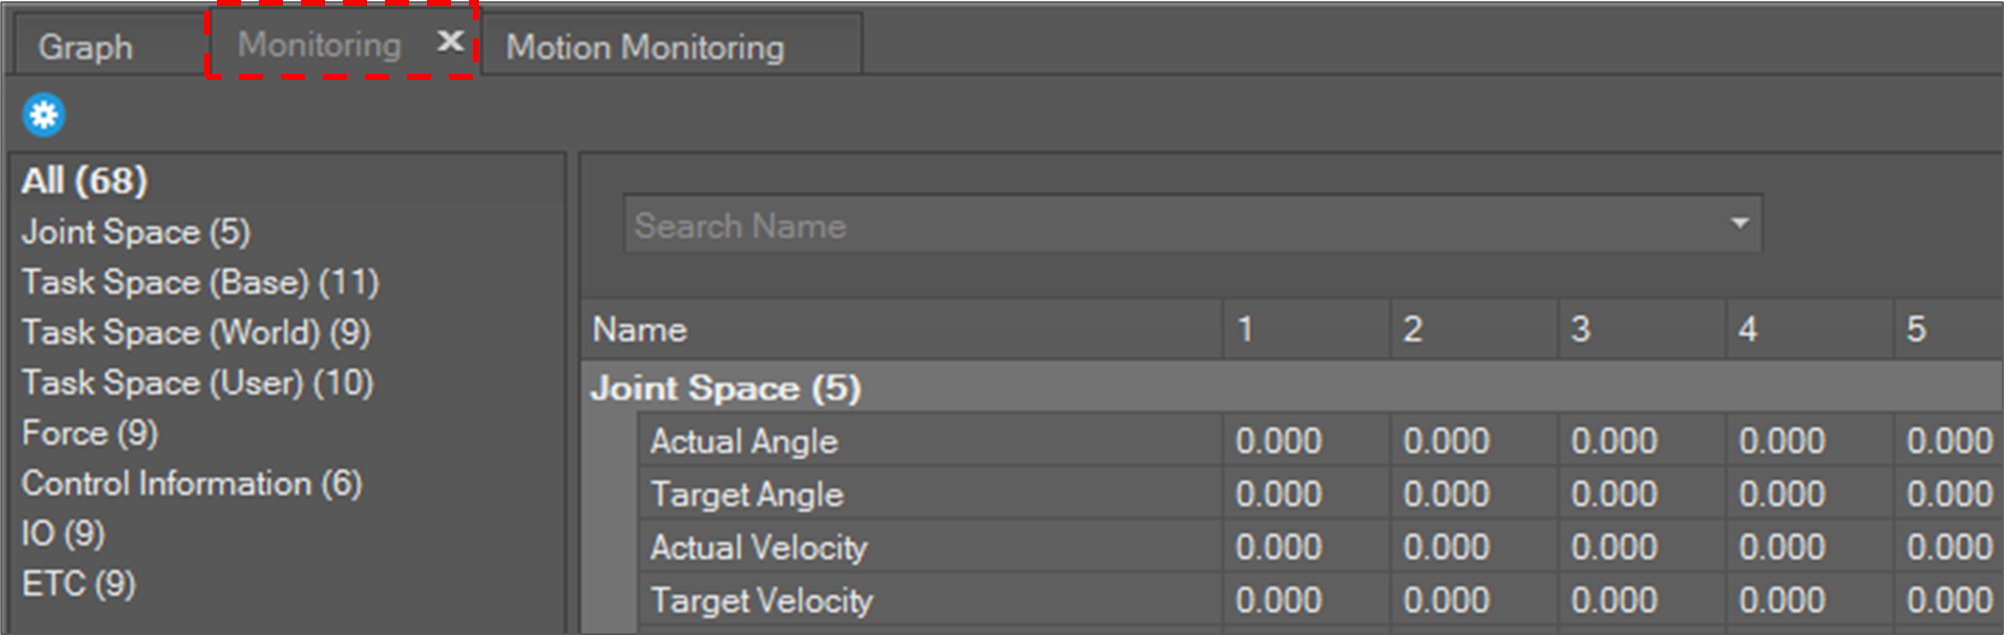
Each row shows a monitoring item and each row’s column size varies for each monitoring item dimension. For example, “Joint Angle” needs six columns to display values from joint axis 1 to 6 and Controller Digital Input needs 16 columns to display its state from port 1 to 16.
Most of the status values are updated every 100 milliseconds. In the case of IO status, the values are updated when its value is changed.
Status information is as in the table below.
|
Joint Space |
|
|
Task Space (Base) |
|
|
Task Space (World) |
|
|
Task Space (User) |
|
|
Force |
|
|
Control Information |
|
|
IO |
|
|
ETC |
|